A Journey to Master Forex Trading (FX Trader from Singapore)

Sunday, December 28, 2008

Generate Buy and Sell Signals

To generate his own Buy and Sell signals by just following a simple technique of combining two or more technical indicators from a technical analysis by following the TREND. As it is usually said in forex trading that the trend is your friend!

First of all you must understand the definition and working of each of the technical indicators you want to use, like ADX, Stochastic, MACD, RSI, Parabolic SAR, Momentum and Bollinger Bands. As a matter of fact you must do a lot of study and research and then come out with the technical indicators you are most comfortable with.

The combinations are as follows: (1) ADX with Stochastic; (2) MACD with RSI; (3) MACD with Parabolic SAR; (4) RSI with Momentum; (5) RSI, ADX with Parabolic SAR; and (6) Bollinger Bands with ADX.

1. ADX with Stochastic;

Signal to buy:
When either %K or %D falls below the line, and then again crosses the bottom level upwards or when the curve %K crosses the curve %D from below upward.
When DMI+ is higher than DMI-

Signal to sell:
When oscillator grows above the line, and then crosses the top level downwards or when the curve %K crosses a curve %D from top to downward.
When DMI+ is lower than DMI-.

2. MACD with RSI;

Signal to buy:
When the MACD rises above the Signal line & above Zero
When the RSI rises above 30

Signal to sell:
When the MACD falls below the Signal line & is below zero
When the RSI is below 70

3. MACD with Parabolic SAR;

Signal to buy:
When a MACD bar is over 0 level and rising, signal line below bars end and rising and SAR dots below price chart.

Signal to sell:
When MACD bars is below 0 level and falling, signal line over bars end and falling and SAR dots over price.

4. RSI with Momentum;

Signal to buy:
RSI rises above 50 but stays below 70, and momentum rises above zero.

Signal to sell:
RSI falls below 50 but stays above 30, and momentum falls below zero

5. RSI, ADX with Parabolic SAR;

Signal to buy:
1- When RSI cross 30 level and rising up
2- SAR dots below the price chart
3- DMI+ over DMI-, ADX line cross 20 level, ADX and DMI+ rising and DMI- falling.

Exit when SAR dots make a cross with the price chart & ADX moving below 30 from above while above DMI+ and DMI-

Signal to sell:
1- When RSI cross 70 level & falling down
2- SAR dots over the price chart
3- ADX line cross 20 levels and rising where DMI+ falling and DMI- rising.
Exit when SAR dots make a cross with price chart & ADX moving below 30 from above
& above DMI+ and DMI-

6. Bollinger Bands with ADX.

Signal to buy:
When the price below the lower band of Bollinger (20, 2) & DMI+ cross over DMI-, ADX line cross 20 level, ADX and DMI+ rising and DMI- falling.

Signal to sell:
When the price above the upper band of Bollinger (20, 2) & ADX line cross 20 levels and rising where DMI+ falling and DMI- rising.


Sunday, December 21, 2008

Average True Range (ATR)

Introduction

Developed by J. Welles Wilder and introduced in his book, New Concepts in Technical Trading Systems (1978), the Average True Range (ATR) indicator measures a security's volatility. As such, the indicator does not provide an indication of price direction or duration, simply the degree of price movement or volatility.

As with most of his indicators, Wilder designed ATR with commodities and daily prices in mind. In 1978, commodities were frequently more volatile than stocks. They were (and still are) often subject to gaps and limit moves. (A limit move occurs when a commodity opens up or down its maximum allowed move and does not trade again until the next session. The resulting bar or candlestick would simply be a small dash.) In order to accurately reflect the volatility associated with commodities, Wilder sought to account for gaps, limit moves, and small high-low ranges in his calculations. A volatility formula based on only the high-low range would fail to capture the actual volatility created by the gap or limit move.

Wilder started with a concept called True Range (TR) which is defined as the greatest of the following:

  • The current High less the current Low.
  • The absolute value of the current High less the previous Close.
  • The absolute value of the current Low less the previous Close.

If the current high-low range is large, chances are it will be used as the True Range. If the current high-low range is small, it is likely that one of the other two methods would be used to calculate the True Range. The last two possibilities usually arise when the previous close is greater than the current high (signaling a potential gap down or limit move) or the previous close is lower than the current low (signaling a potential gap up or limit move). To ensure positive numbers, absolute values were applied to differences.

Average True Range example image from StockCharts.com

The example above shows three potential situations when the TR would not be based on the current high/low range. Notice that all three examples have small high/low ranges and two examples show a significant gap.

  1. A small high/low range formed after a gap up. The TR was found by calculating the absolute value of the difference between the current high and the previous close.
  2. A small high/low range formed after a gap down. The TR was found by calculating the absolute value of the difference between the current low and the previous close.
  3. Even though the current close is within the previous high/low range, the current high/low range is quite small. In fact, it is smaller than the absolute value of the difference between the current high and the previous close, which is used to value the TR.

Note: Because the ATR shows volatility as an absolute level, low price stocks will have lower ATR levels than high price stocks. For example, a $10 security would have a much lower ATR reading than a $200 stock. Because of this, ATR readings can be difficult to compare across a range of securities. Even for a single security, large price movements, such as a decline from 70 to 20, can make long-term ATR comparisons difficult.

Calculation

Typically, the Average True Range (ATR) is based on 14 periods and can be calculated on an intraday, daily, weekly or monthly basis. For this example, the ATR will be based on daily data. Because there must be a beginning, the first TR value in a series is simply the High minus the Low, and the first 14-day ATR is the average of the daily ATR values for the last 14 days. After that, Wilder sought to smooth the data set, by incorporating the previous period's ATR value. The second and subsequent 14-day ATR value would be calculated with the following steps:

  1. Multiply the previous 14-day ATR by 13.
  2. Add the most recent day's TR value.
  3. Divide by 14.

Average True Range example table

In the Excel spread sheet example above, the first True Range value (1.9688) equals the High minus the Low. The first 14-day ATR value (3.6646) was calculated by finding the average of first 14 True Range values. The second ATR value was smoothed by using the previous value.

Sun Microsystems, Inc (SUNW) ATR example chart from StockCharts.com

For those trying this at home, here are a few caveats:

  • There is always a beginning, and the first calculations may not conform exactly with the formula. The first True Range value is simply the High minus the Low, and the first ATR is a simple average of the first 14 True Range values.
  • Many indicators involve a smoothing process. In this example, the current ATR calculation uses the previous period's ATR.
  • The size of the data set will affect the final outcome. This example only contains a small portion of the available historical price data. Although the difference is not likely to be huge, a data set of 33 days will produce a different ATR value than a data set of 500 days.
  • Due to rounding issues and decimal places, an exact match may not be possible.

(If you want to create an ATR from your own data, first try to duplicate the above example using the provided Open-High-Low-Close data. Once your calculations match the example's, you can then plug in your own Open-High-Low-Close data.)

International Business Machines (IBM) ATR example chart from StockCharts.com

The IBM chart above provides an example of the 14-day ATR in action. Extreme levels (both high and low) can mark turning points or the beginning of a move. As a volatility-based indicator like Bollinger Bands, the ATR cannot predict direction or duration, simply activity levels. Low levels indicate quiet trading (small ranges), and high levels indicate violent trading (large ranges). A prolonged period of low ATR readings might indicate consolidation and the beginning of a continuation move or reversal. High ATR readings usually result from a sharp advance or decline and are unlikely to be sustained for extended periods.

Average True Range (ATR) and SharpCharts

SharpCharts application ATR example image from StockCharts.com

The ATR is on the Indicators drop-down menu, listed as "Average True Range." The Parameters box to the right of the indicator contains the default value, 14, for the number of periods used to smooth the data. To adjust the period setting, highlight the default value, and enter a new period setting. SharpCharts also allows you to position the indicator above, below, or behind the price plot.


An Indicator to Catch Market Swings

The ATR (Average True Range) indicator is not a leading indicator. It is designed to help you gauge the average size of a trading range.

Defined, it is the high minus the low for a given period of time. That period can be a day, a one hour bar, a one minute bar, or even a week. It's averaged over a period of time (i.e., 14 days) to smooth out that number.

ATR can serve as an early warning system. ATR essentially gives you an idea of how much price is fluctuating at any moment in time. When ATR bottoms out, it tends to signal the possibility of rising market action. Conversely, when it peaks, it tends to signal that price action could potentially decline.

Where the trading range is narrow, you will notice that the daily highs and lows are not all that wide. But, as price breaks out of its channel and starts trending, the difference between the highs and lows usually starts to widen. And, as the trending market starts to lose its steam, you'll see the highs and lows start to come closer together again.

The urge to over-trade is ever present in a trader’s mind. One of the greatest challenges in short-term trading, or day trading, is to overcome such a tendency. You'll notice how ATR rises and peaks at various times. Then, things slow down. And, yet again, ATR begins to rise once more. Knowing that this phenomenon occurs on a regular basis will serve as a constant reminder to you that setups that are occur during quiet times probably are not the real deal. You can apply this same knowledge to longer-term charts to give you a relative perspective on where things stand overall.

You need currency trading strategies (a.k.a. forex trading strategies). The trick is to trade less often, and hold onto positions longer. The challenge, obviously, is to determine exactly how long is too long. Indicator fascination will only get you in trouble, as most indicators either get you out of trades too soon, causing you to miss a major move, or keep you in too long, causing you to give back gains.

You need a more precise way of determining when to bail. Using ATR only makes sense – combined with other aspects of technical analysis. Combining your own experience with an ability to properly read charts will enable you to see more clearly where the best entry and exit points are. As a consequence, you will catch more of the major moves, and trade less often – moving you closer to being truly profitable with your trading endeavors.

Study ATR’s behavior. See where it bottoms out and peaks. See if you couldn’t apply this rhythm to your own trading to pinpoint those times that would be best suited to your buy/sell decisions. You might even be able to use this indicator to help you catch the daily swings – like jumping in on the high for the day, riding it down to the low, cashing out, seizing the opportunity to buy the low on the day, riding it out, and then banking your profits. Sounds too good to be true – and overly simplistic – but it does have merit, if you look closely at any chart you are working with, where ATR can be plotted. Most charting platforms/software offer it.


Saturday, December 20, 2008

Keltner Channel

The Keltner Channel is a moving average band indicator whose upper and lower bands adapt to changes in volatility by using the average true range. The Keltner Channel is used to signal price breakouts, show trend, and give overbought and oversold readings.

There are many variations to calculating the Keltner Channel, but generally speaking a moving average (10 or 20-period) of the typical price [(High + Low + Close)/3] is used to construct the midline. Then the average true range is calculated over a time period (same as midline, 10 or 20-period) and multiplied by a multiple (usually 1.5); the calculated number is then added to the midline to form the upper Keltner Channel and subtracted from the midline to form the lower Keltner Channel.

A chart of gold futures illustrates a Keltner Channel with a 20-day moving average and an average true range multiplier of 1.5:

keltner channel 20 day moving average and average true range multiplier of 1.5

There are numerous, sometimes contradictory, ways to interpret the Keltner Channel. The first method is price breakouts outside of the Keltner Channel.

Keltner Channel Buy Signal

When price closes above the upper band, buy.

Keltner Channel Sell Signal

When price closes below the lower band, sell.

Keltner Channels are sometimes interpreted the opposite way.

The Keltner Channel breakout methodology works great during the transition from range-bound, trendless markets to uptrends or downtrends. However, during those actual trendless market periods, buying breakouts can be costly. During trendless periods, using the Keltner Channel as an overbought/oversold indicator can prove profitable.

The chart below of the Nasdaq 100 ETF (QQQQ) shows an example of a trendless market:

keltner channel overbought and oversold buy and sell signals

Keltner Channel Oversold Buy Signal

When there is a price breakout below the lower Keltner Channel band, wait until the price closes back inside the Keltner Channel. By waiting for a close back inside the Keltner Channel, a trader usually can avoid getting caught in a true Keltner Channel downside breakout.

Keltner Channel Overbought Sell Signal

With a price breakout above the upper Keltner Channel band, it may be advisable to wait until the price closes back inside the Keltner Channel. When a trader waits for a close back inside the Keltner Channel, that trader can usually avoid large losses by not getting caught in a true Keltner Channel breakout to the upside.

When combined with other technical analysis indicators, Keltner Channels can be a helpful tool in a trader's arsenal.


How I Trade Support and Resistance

Support and resistance is a fundamental concept in trading. I would suspect most of the readers of this blog have at least a basic understanding of how support and resistance works in markets.

Here is a good definition of support and resistance. What I wanted to talk about is how I use it in my trading activities.

I trade with three fundamental attributes of support and resistance:

1. For me, support and resistance are zones, not finite numbers. The greater the timeframe, the more this attribute applies. I am looking at daily charts and longer, I draw the support and resistance zone as 1/4 ATR beyond the level of support. I expect that price will begin to change direction in this area. Combined with moving averages and certain patterns, like the hammer, this has worked well.

2. Support/resistance is validated by the number of times the zone is touched. Corey at afraid to trade used this “number of times touched method” as one measure to assess the validity of trend lines. I share his conclusions. When I observe price bounce off a zone of support and resistance multiple times, I know that zone is strong. It’s my interpretation that the higher the time frame (days, weeks, months…), the more powerful the zone has become.

3. Don’t forget pivots when trading intraday. Perhaps using pivots deserve their own article. Pivots are areas of support and resistance calculated from the previous day’s high, low, open, and close. The true value in the pivot numbers is that they are widely followed. The whole concept of support and resistance is that support and resistance holds because so many traders buy or sell when price hits a certain number. This is exactly why pivots are useful from an intraday perspective. Pivot points are generally calculated the same way. So when you look at a widely traded contract like the emini S&P, price will bounce, consolidate, and break around pivot points. Here is an excellent pivot point calculator.

Hope this got you thinking about how you use support and resistance in your own trading. It’s an easy concept to understand, so it’s easy to brush off as not as important.


Original post


Tuesday, December 16, 2008

Technical Indicators

Technical Indicators


Indicators

BUY

SELL

ADX (14)

DMI+ over DMI-

ADX line cross 20 level

ADX and DMI+ rising and DMI- falling

DMI+ lower than DMI-

ADX line cross 20 levels and rising where DMI+ falling and DMI- rising

Bollingerbands (2, 20)

When the price below the lower band of Bollinger (20, 2)

When the price above the upper band of Bollinger (20, 2)

Commodity Channel Index, CCI (14)

When the CCI go below -100 line it means it’s an oversold mood and the trader have to wait the reversal of the trend and the CCI must went to above -100 line in order to take long.

When the CCI go above +100 line it means it’s an overbought mood and the trader have to wait the reversal of the trend and the CCI must went to below +100 line in order to take short.

MACD (12, 26, 9)

When the MACD rises above the Signal line & above Zero

MACD bar is over 0 level and rising, signal line below bars end and rising

When the MACD falls below the Signal line & is below zero

MACD bars is below 0 level and falling, signal line over bars end and falling

Parabolic Systems (0.02, 02)

SAR dots below the price chart

SAR dots over the price chart

RSI (14)

When the RSI cross 30 and rising up
RSI rises above 50 but stays below 70

When the RSI crosss 70 and falling down
RSI falls below 50 but stays above 30

Stochastics (5, 3)

When either %K or %D falls below the line, and then again crosses the bottom level upwards or when the curve %K crosses the curve %D from below upward.

When oscillator grows above the line, and then crosses the top level downwards or when the curve %K crosses a curve %D from top to downward.

Williams %R (14)

BUY when it reaches 80% or higher (the market is oversold).

SELL when %R reaches 20% or lower (the market is overbought)

-

-

-


Monday, December 15, 2008

MACD (Moving Average Convergence/Divergence)

Quick Summary

Trading with MACD indicator includes the following signals:

MACD lines crossover — a trend is changing
MACD historam staying above zero line — market is bullish, below — bearish.
MACD histogram flipping over zero line — confirmation of a strength of a current trend.
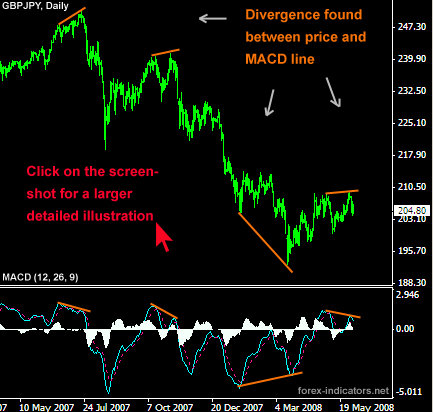
MACD histogram diverges from price on the chart — signal of an upcoming reversal.

Details

MACD is the simplest and very reliable indicators used by many Forex traders.
MACD (Moving Average Convergence/Divergence) has in its base Moving Averages.

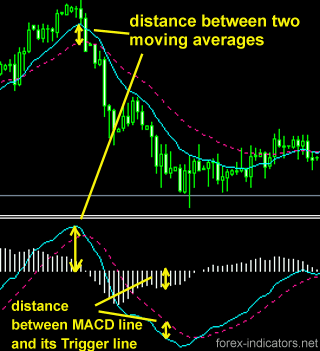
It calculates and displays the difference between the two moving averages at any time. As the market moves, moving averages move with it, widening (diverging) when the market is trending and moving closer (converging) when the market is slowing down and possibility of a trend change arise.

Basics behind MACD indicator

Standard indicator settings for MACD (12, 26, 9) are used in many trading systems, and these are the setting that MACD developer Gerald Appel has found to be the most suitable for both faster and slower moving markets. In order to get a more responsive and faster performance from MACD one can can experiment with lowering MACD settings to, for example, MACD (6, 12, 5), MACD (7, 10, 5), MACD (5, 13, 8) etc.
These custom MACD settings will make indicator signal faster, however, the rate of false signals is going to increase.

MACD indicator is based on Moving Averages in their simplest form. MACD measures the difference between faster and slower moving average: 12 EMA and 26 EMA (standard).

MACD line is created when longer Moving Average is subtracted from shorter Moving Average. As a result a momentum oscillator is created that oscillates above and below zero and has no lower or upper limits. MACD also has a Trigger line. Combined in a simple lines crossover strategy, MACD line and trigger line crossover outperforms EMAs crossover.

Besides being early on crossovers MACD also is able to display where the chart EMAs have crossed: when MACD (12, 26, 9) flips over its zero line, if indicates that 12 EMA and 26 EMA on the chart have crossed.

Forex MACD

How does MACD indicator work

If to take 26 EMA and imagine that it is a flat line, then the distance between this line and 12 EMA would represent the distance from MACD line to indicator's zero line.
The further MACD line goes from zero line, the wider is the gap between 12EMA and 26 EMA on the chart. The closer MACD moves to zero line, the closer are 12 and 26 EMA.

MACD histogram measures the distance between MACD line and MACD trigger line.


Forex MACD trading

MACD indicator Formula

MACD = EMA(Close)period1 - EMA(Close)period2
Signal Line = EMA(MACD)period3

where
period1 = standard settings are 12 bars
period2 = standard 26 bars
perid3 = standard 9 bars

The following are the steps to calculate MACD

1. Calculate the 12-days EMA of closing price
2. Calculate the 26-days EMA of closing price
3. MACD = 12-days EMA - 26-days EMA
4. Signal Line = 9-days EMA of MACD

Formula for EMA

EMA = (SC X (CP - PE)) + PE

SC = Smoothing Constant (Number of days)
CP = Current Price
PE = Previous EMA

Trading MACD Divergence

MACD indicator is famous for its MACD Divergence trading method.

Divergence is found by comparing price shifts on the chart and MACD values.
MACD Divergence phenomenon occur as a result of shifting forces on the Forex market.
For example, while Sellers may seem to be dominating the market at the moment and price continues to trend down, there already might be signals for an overall weakening of Sellers power. This key warning moments can be observed with MACD indicator. What Forex traders would see is that despite price making new Lower Lows, MACD doesn't confirm that and instead registers a Higher Low, signaling that Sellers are running out of steam and a trend change is on its way.

Opposite will be true for Buyers.

How to trade MACD Divergence

When MACD line (on our screenshot it is a blue line) crosses Signal line (red dotted line) - we have a point (top or bottom) to evaluate. With two most recent MACD line tops or bottoms find corresponding tops/bottoms on the price chart. Connect MACD tops/bottoms and chart tops/bottoms.
Evaluate the lines received, as shown on the larger screenshot (click on the small picture to enlarge).

MACD divergence in Forex explained

With MACD divergence spotted Enter the market when MACD line crosses over its zero point.
Another entry strategy is to find 2 most recent swings high or low on the chart and draw a trend line trough them; and then set an Entry order on the breakout of that trend line.

MACD divergence trading method used not only to predict trend turning points, but also for trend confirmation. A current trend has high potentials to continue unchanged in case no divergence between MACD and price was established after most recent tops/bottoms evaluation.


Thursday, December 11, 2008

Trading 2008-12-12

Balance 1,410.85 Deposit 531.02

Open Short: 10,000 USD/CHF @ 1.18504
Stop level: 1.1997, 1.1851
Target level: 1.1780, 1.1750, change to Trailing stop
Closed: 1.1811 (Profit CHF 39.40)
* DailyFX+, ADX sell, AO sell, Para sell

Open Short: 10,000 USD/CAD @ 1.2193
Stop level: 1.2313, 1.2240, 1.2195
Target level: 1.2100
Closed: 1.2195 (Loss CAD 2.00)
* DailyFX+, ADX sell, AO sell, Para sell

Open Short: 10,000 USD/CHF @ 1.19269
Stop level: 1.2020
Target level: 1.1860
Closed: 1.186 (Profit CHF 66.90)
* DailyFX+, ADX sell, AO sell, Para sell


***

Wednesday, December 10, 2008

Trading 2008-12-11

Open Long: 10,000 USD/CHF @ 1.19269
Stop level: 1.2020
Target level: 1.1860
Closed:
* DialyFX+, ADX sell, AO sell, Para sell

Open Long: 10,000 USD/CHF @ 1.19415
Stop level:
Target level:
Closed: 1.1931 (Loss CHF 10.50 )
*** Mistake, close position

Open Long: 10,000 EUR/AUD @ 1.98388
Stop level: 1.9620
Target level: 1.9936
Closed: 1.9620 (Loss AUD 218.00)
* DailyFX, ADX buy, Para buy, Stoch sell, AO Buy

Open Long: 10,000 EUR/CHF @ 1.56406
Stop level: 1.5560
Target level: 1.5688
Closed: 1.573 (Profit CHF 89.40)
* DailyFX, ADX buy, Parabolic buy

Open Short: 10,000 AUD/JPY @ 60.81
Stop level: 61.1938
Target level:
Closed: 61.1938 (Loss JPY 3,838)

Open Short: 10,000 AUD/USD @ 0.6565
Stop level: .06633
Target level: 0.6470
Closed: 0.6633 (Loss USD 68.00)
* ADX, Parabolic, DailyFX+

Open Long: 10,000 EUR/JPY @ 120.79
Stop level: 119.624
Target level: 122.216
Closed: 121.5 (Profit: JPY 7,100)
* ADX sell, Parabolic buy, DailyFX+

Open Long: 10,000 USD/CHF @ 1.19888
Stop level: 1.1900
Target level: 1.2111
Closed: 1.19 (Loss CHF 88.80)
* ADX sell, Parabolic sell, Double bottom

Open Long: 10,000 NZD/USD @ 0.54998
Stop level: 0.5422
Target level: 0.5588
Closed: 0.5422 (Loss USD 77.80)
* ADX, Parabolic - BUY
* Probably bad move. Already hitting resistance

Subscribe to FXCM to get DailyFx+ signal

***

How to Trade Using Bollinger Bands

How to Trade Using Bollinger Bands

Bollinger bands are designed to give traders a feel for what the volatility is in the market and how high or low prices are relative to the recent past. The basic premise of Bollinger bands is that price should normally fall within two standard deviations (represented by the upper and lower band) of the mean which is the center line moving average. As this is the case trend reversals often occur near the upper and lower bands. As the center line is a moving average which represents the trend in the market, it will also frequently act as support or resistance.

The first way that traders use the indicator is to identify potential overbought and oversold places in the market. Although some traders will take a close outside the upper or lower bands as buy and sell signals, John Bollinger who developed the indicator recommends that this method should only be traded with the confirmation of other indicators. Outside of the fact that most traders would recommend confirming signals with more than one method, with Bollinger bands prices which stay outside or remain close to the upper or lower band can indicate a strong trend, a situation that you do not want to be trading reversals in. For this reason selling at the upper band and buying at the lower is a technique that is best served in range bound markets.

Buying and Selling at the Upper and Lower Bands

A Chart Showing the Strategy of Buying and Selling at the Bollinger Band Upper and Lower Bands

Large breakouts often occur after periods of low volatility when the bands contract. As this is the case traders will often position for a trend trade on a break of the upper or lower Bollinger band after a period of contraction or low volatility. Be careful when using this strategy as the first move is often a fake out.

Bollinger Band Contractions

As Bollinger bands paint a good picture directly on the price chart of how high or low price is relative to historical prices, this is a good indicator to use in conjunction with other methods such as some of the chart patterns that we have learned so far and some of the candlestick patterns which we will learn in future lessons.

Below is One Such Example

A Chart Showing Bollinger Bands with Multiple Confirmations


Forex Trading Resources

Beginner's Paradise

If you're a forex newbie, the following sites will help you get a grip on the similarities and differences between forex trading and stock exchange trading. Take advantage of free resources before you dedicate any serious cha-ching to training.

  1. Tip'd: Investing and Finance Social Media / News — Get the latest forex, commodities, and market news from the largest investing social media site.
  2. Currency College — Currency College delivers a variety of course offerings with classes that are held at the student’s convenience. Each class is followed by homework and tests; each course lasts about six weeks; and each class contains about ten students. Emphasis is given to risk management. This is not free education, but if you bring referrals to Currency College you could earn a scholarship toward your tuition. This site has plenty of free resources, however, like a comparative chart for various trading platforms so you can make an educated choice about trading platforms.
  3. CyberTrading University — This site offers free forex training through a two-hour video that includes a brief history, PIP spreads, majors and crosses, economic indicators, fundamental analysis, technical analysis, short-term long-term fundamentals, trading rules, leverage and margin, trading psychology, Fibonacci Retracement Levels, moving averages, oscillators, Candlestick Charts, Bollinger Bands, and more.
  4. Forex Charting 101 — A brief and basic overview of forex charts from Pip Trader. You'll discover that the charts are very similar to those that you might use for securities trading. But, some of the charts may seem more complicated if you're not a seasoned trader.
  5. Forex Realm — Possibly the most comprehensive and thorough forex education online. Learn about everything from currency codes to exotic trading strategies through articles, graphics, and concise examples.
  6. Forex-Training.com — Fairly comprehensive training with a free demo account. The highlight to this site is their explanations about various charts.
  7. FX Home Trader — Focus on the information about technical analysis, where you can learn more about Fibonacci Trading, Pivot Points, and more. Their Forex Facts also contain some valuable information.
  8. FX Power Trading Course — Offered by FXCM, this paid course is one step up from free at the current price. Learn how to time the market, recognize trends, and basics in fundamental and technical analysis through this eight-day course.
  9. Investopedia on Forex — An extensive 10-part article on forex investing, from an introduction to a recap that covers everything from benefits and risks to technical analysis. If you can't get enough of Investopedia's information, head to a list of their Forex articles, where you can learn more and download their free e-Book entitled, "High Probability Trading Setups for the Currency Market."
  10. Law of Charts — Joe Ross offers advice for traders across the board, but the information contained in his "Law of Charts" offer speaks to forex as well as any other trading strategy. He identifies chart patterns that result from human behaviors and points to entry and exit targets on those charts. You can take advantage of Ross's other tools as well, including the forum.
  11. Learn4X — This is an interesting site simply because it contains several tests that help you determine if you have the 'guts' and knowledge to be a trader. They also offer a free online seminar.
  12. Market Traders Institute (MTI) — You don't need to spend a lot of money to train in forex markets. MTI offers many free resources such as videos and lesson plans that will help you get off the ground. If you like what you hear and see, you can invest in materials for the advanced trader down the road.
  13. My Forex Trading Tools — A site that contains overviews on everything from fundamentals to options.
  14. Online Training Academy — Free basics on FX trading via video, offered by Mike McMahon. You need to register, but you can opt out of contact lists with a click of a box.
  15. School of Pipsology — A lighthearted forex education from Kindergarten to College so the beginner knows exactly where he stands in an attempt to grasp the forex market.

Blogs & News

The following list provides a variety of news from both professional and single-investor resources.

  1. A Forex Loser — The name of the blog ought to warn you. This blog contains a different perspective on trading, with an emphasis on trading psychology. Some great trading tips.
  2. Currency Secrets — Not updated daily, but plenty of resources in historical entries. The focus is on currency, but you can find plenty of reviews and tips here as well.
  3. DailyFX — Sponsored by Forex Capital Markets (FXCM), this site offers a free weekly trading lesson, a forum, economic calendar, and free quarterly outlook reports.
  4. Forex News — At-a-glance links to news and analyses.
  5. Forex Project — A fascinating blog written by a forex beginner who logs his experiences in a journal, through established goals, and with a full trade history. This blogger currently is under pressure from a fulltime job, and he's considering a transition from day trading to going long on his investments. Should be an interesting read. Be sure to check out this blogger's list of references, including a nice beta risk calculator.
  6. Forex Reader — Daily currency trading news and commentary.
  7. FX Boot Camp — Wayne McDonell offers his boot camp theories for free at his blog on FXStreet (see next).
  8. FXStreet — Breaking news, commentary. Sponsored by Global Forex Trading (GFT).
  9. Peter Bain Forex Trading Commentary — Peter Bain's commentary needs to be good, as it's a tool to push his training course. You can take advantage of his free podcasts as well.
  10. Piptopia — This is Rob Booker's blog on forex. He's a currency trader and trainer and he's been at this blog for two years, so you'll find some interesting history here.
  11. Grace Cheng's Forex Blog — "Not long after my graduation, I was introduced to forex trading, and since then, have never looked back." Outside of her blog, Cheng writes for a number of trading and investment magazines.
  12. Quantitative Trading — Dr. Ernest Chan's take on automated, statistical trading strategies.
  13. Trader Mike — Michael is a trader, and this blog is a trading journal of sorts. Although he considers himself a swing/position trader, he switched to day trading in 2005. Although this blog doesn't focus on forex per se, you can learn plenty about trading strategies here.

Charts

You can't trade without charts, but the chart that you use is a matter of personal preference. The list below provides a nice pool to pick from:

  1. DailyFX Chart — You can manipulate this chart by type, time scale, view, and much more. Java based.
  2. Free Forex Charts — From simple to Premium to System Trading, simply the best choice of charts around.
  3. Forex-Market — This site offers two free, real-time charting applications, one Web-based and the other a stand-alone Java applet.
  4. Live Currency Chart — This chart, offered by FXStreet (see Blogs & News above), is also Java based. A nice feature is the Drag&Drop that allows traders to pull indicators out of the Studies window and up into the Chart window.

Currency & Converters

Currencies can be confusing, especially when you learn that many lots are purchased in pairs. You can learn about specific currencies when you type the names of that currency into a search engine. For instance, you can learn more about the Euro at that currency's official site. But, if you don't know what to look for, the information found in the following sites will help you out:

  1. ADVFN Forex Symbol Table — Comprehensive list of currencies. When you click on the currency symbol you'll reach a page where that currency is represented through currency exchange rate tables and historical exchange rate charts.
  2. ExchangeRate.com — Try out the "hot" and "currency info" links that provide information about everything you'd want to know about worldwide currencies for 170 countries. Includes calculators, fun facts, serious facts, and more.
  3. Go Currency — Reliable currency converter and money conversion service.
  4. List of Currencies — This is an extensive list provided by Wikipedia that covers everything from ancient coinage to the current Yen. As with most Wikipedia lists, you might run across a link or two that doesn't contain information. But, you can use that information to search elsewhere if needed.
  5. Oanda — Excellent set of currency converter tools from historical currency exchange rates for over 164 currencies to traveler's cheat sheets to customizable products. Visit their detailed currency converter FAQ page if you have questions.
  6. X-Rates — More than a currency list or a converter, this site will bring you up-to-date on every bit of information you'd need to know as a forex trader.
  7. XE.com — A basic currency converter backed up by other tools on this site, such as current and historic rate tables and a free email currency update service.

Directories & Portals

The following resources offer choices beyond the ones listed here. Since forex is a booming individual trader industry, expect to find new sites popping up weekly.

  1. Earn Forex — A limited list, but some great resources broken down by category. This list is just one feature to this site, as you can access calculators, a blog, and information for beginners here.
  2. Forex Bastards — Don't let that empty page or the name put you off. Click on other categories to find some interesting resources. This is a project in the making, brought to you by the Secret Forex Society.
  3. Forex Central — You want it? They have most of it (blogs are missing). Resources aren't rated.
  4. Forex Directory — This site is a little difficult to slug through, but worth it for the resources provided.
  5. Pip Trader — This site contains a forum, live quotes and charts, news, reports, and a "mini-game" that has nothing to do with forex, but that might help you lighten up a bit.
  6. Top 100 Forex Sites — Although these sites are rated by popularity and, therefore, subject to rating scams, you can learn much from the sites that are listed simply from the variety of information that's offered here. Many sites are brokerage firms, but as I mentioned previously you can find free information on many of these sites such as news, calculators, techniques, and more.

Economic Calendars & Indicators

Economic calendars and indicators are vital tools for fundamental research. The sites below will give you simple and detailed options.

  1. Economic Indicators — A government site brought to you by the Economics and Statistics Administration at the US Department of Commerce. Their mission is to provide timely access to the daily releases of key economic indicators from the Bureau of Economic Analysis and the US Census Bureau.
  2. Forex Economic Calendar — What better place to find an excellent economic calendar than a site that focuses on this tool?
  3. Global Forex Trading (GFT) — A detailed look into the next month's international monetary future based on GMT.
  4. InfoForex — Brief overviews on various sectors from Auto and Truck Sales to a Monthly Wholesale Trade report based upon the US Census.

Fibonacci & Candlesticks

Fibonacci and Japanese Candlestick charts may seem difficult, but with the right training you can master both technical strategies.

  1. Fibonacci — This is the home page for Dr. Ron Knott's multimedia Web site on the Fibonacci numbers, the Golden section and the Golden string hosted by the Mathematics Department of the University of Surrey, UK. Simple to use, easy to understand, and filled with illustrations to help you learn why some numbers are so important to nature. These numbers are also of vast interest to many forex investors.
  2. Fibonacci Forex Indicators — Forex Planet will begin to show you how to apply Fibs to forex in this easy-to-understand lesson. But, the lesson is short, so you might try the next resource as well.
  3. Fibonacci Method in Forex charts — This lesson also applies to forex, and it offers a short tutorial on applications along with a downloadable Fib calculator.
  4. Japanese Candlesticks — FX Words offers a simple and succinct explanation for candlesticks, including bullish and bearish patterns.
  5. Japanese Candlesticks (Elliott Gann) — A comprehensive tutorial that covers all the basic terminology and explains each term with appropriate graphics, offered by the ElliottGann site.
  6. Japanese Candlestick Trading Forum — It costs to become a member, but you can access all the candlestick basics for free on this site.

Forecasts and Signals

The following resources use a mix of fundamental and technical analyses to formulate their prognoses:

  1. AceTrader — True 24 hours real-time analysis for up-to-the-minute recommendations and analysis.
  2. e-Forex — Free trading signals. Dig into their historical records to understand their precision.
  3. Forex Predictions — Currently free daily and weekly high-low signals through the Web site and by email. This site is a division of RDC Bancorp, Inc., a foreign exchange services company.
  4. Forex Signals — FinoTek provides signals and trends with charts. Check out their archived signals to determine credibility.
  5. Investica Ltd. — Online information and free e-newsletters filled with signals and forecasts.
  6. Open Forex — Daily forecasts in real trade and analytical articles on forex basic currency pairs.

Forums and Communities

  1. Forex Factory — You'll find a Forex Beginner Q&A section as well as topics that focus on specific strategies and techniques.
  2. Forex TSD — Go ahead and lurk in this forum until you feel comfortable. Then register for free to access the forum and a calendar. The paid "elite" subscription offers detailed statements of currently more than 20 trading systems.
  3. Global View Forums — Another free forum that's been around since 1996.
  4. MoneyTec — With over 33,000 members, this traders' forum offers a format to discuss trading ideas, share, learn, and build new trading techniques and strategies.

Fundamental Research

The following list contains comprehensive information about economic fundamentals for your research:

  1. Bureau of Economic Analysis (BEA) — Get the straight stuff from the US Department of Commerce like the pros. Everyone from the White House staff to US Trade Commission employees to trade policy officials who want to negotiate international trade agreements use the measurements contained on the BEA Web site.
  2. Consumer Price Index (CPI) — The US Department of Labor offers a ton of information just on this page alone through their links.
  3. Forex Daily Fundamentals — XpressTrade offers a daily focus on forex fundamentals.
  4. The Bank for International Settlements (BIS) - An international organization which fosters international monetary and financial cooperation and serves as a bank for central banks. As such, this organization offers valuable information through their publications and research as well as through many other resources offered on this site. They also maintain a list of Central Bank Web sites.
  5. The Fundamentals of Forex — Forex TV brings you the lowdown on what type of news would affect forex from a fundamental standpoint. You can use the information on this list to conduct further research.

Glossaries

  1. Forex Glossary — The only drawback to this glossary is that the "A-Z" tab doesn't include a total listing of all the terms under the single-letter tabs. Comprehensive.
  2. Forex.com Glossary — An at-a-glance glossary contained on one page.
  3. Glossary of Forex Terms [PDF] — This printable file, offered by FX International Group, contains all the basics.

Government Regulation

  1. Australian Securities and Investments Commission (ASIC) — The ASIC's regulatory coverage includes the forex market. Use their search box to learn more about their reach and responsibility.
  2. Commodities Futures Trading Commission (CFTC) — The CFTC operates along the same lines as the SEC (Securities and Exchange Commission), except this government organization focuses on protecting market users and the public from fraud in the futures and option markets. So keep this site handy to stay on top of any forex scams through their Consumer Advisory on Forex Fraud. You can learn quickly what to avoid in your learning curve through a detailed forex advisory that offers information about other resources as well.
  3. Financial Services Authority (FSA) — An independent non-governmental body located in the UK, given statutory powers by the Financial Services and Markets Act 2000. Use their search box to locate information about the UK forex market and regulations.
  4. National Futures Association (NFA) — The NFA is "the premier independent provider of efficient and innovative regulatory programs that safeguard the integrity of the derivatives markets," which basically means that this organization regulates any market that depends upon future cash flows. The "investor information" section contains materials about how to find a broker and basic lessons in forex trading. Plus, they publish forex warnings, news, and they offer a place for investor disputes and complaints.

Market Reports

  1. KBC [PDF] — A Comprehensive "Morning Report" from this Belgian foreign exchange bank (in English).
  2. Mellon — FX Daily report from Mellon Financial Corporation, with links to American and European editions and past issues.
  3. SaxoBank — Daily market update from this foreign exchange service in London.
  4. Scotia Capital [PDF] — Daily report with corresponding links for further reading from this Canadian foreign exchange bank.
  5. UBS — Daily summary for forex markets sponsored by this Swiss foreign exchange bank.

Nonprofit Associations

  1. Australian Technical Analysts Association (ATAA) — A non-profit association of both professional technical analysts and anyone who uses technical analysis for private investing, trading or advising.
  2. International Compliance Association (ICA) — The ICA is a professional organization dedicated to the furtherance of best compliance and anti money laundering practice in the financial services sector.
  3. The Financial Markets Association (ACI) — ACI has the largest membership of any of the international associations in the wholesale financial markets. The Head Office is based in Paris.

Practice

Some of the best demonstration tools are owned by forex brokerages. The following were chosen for their reliability and popularity. Be aware that some brokerages will request your permission to be contacted by mail, phone, or email. In some cases you might want this contact, as they will provide support for your training. In all cases you can walk away if their training and trading platforms don't turn you on.

  1. CMS Forex — Customize your practice with unlimited funds on CMS Forex's VT Trader 1.8.5.1, a program that includes an API so that you can customize your solution. This software offers a point-and-click open and close positions directly on the chart. Access over 100 indicators, Reuters Forex related news and market analytics, and an "autopilot" feature. You can reach their customer support team by phone, live chat, or e-mail.
  2. Forex Trading USA — Free 30-day demo with a Mini ($2,000 virtual cash, 200:1 leverage, 10k lot size) or Standard ($25,000 virtual cash, 100:1 leverage, 100k lot size). Their free education is a nice plus.
  3. FXSolutions — Use $10,000 in practice funds with full access to FXSol's new charting solution, FX AccuCharts. Backed by 24/7 customer service.
  4. Global Forex Trading — Download their DealBook 360 to practice forex trading with live, dealable prices, real-time data, and free real-time breaking world and financial news. The software features forex charts, more than 85 technical indicators (for standard size GFT trading accounts) and the ability to build your own indicators. You have a choice about the amount of beginning funds, from $2,500 to $50,000.

Real-Time Quotes

  1. ACM — Pick pairs and watch the quotes. ACM includes a manual [PDF] that explains in detail how to manipulate the chart to your liking. Must have Java plugin.
  2. Forex Trading Charts — Real-time forex quotes. This site also contains real-time forex charting tools with editable indicators.
  3. FXQuote — Scroll down the page, as the real-time quotes are located at bottom left. Based upon ET.
  4. Live Forex Quotes — You might recognize the GFT logo behind the rates, but don't let that distract you from the constantly changing figures. If you're addicted to live feeds, you'll be mesmerized by the constantly changing currency rates on this chart.
  5. SaxoBank — Scroll down the page a bit, as the quotes are located at the bottom left on this page, based upon GMT.

Technical Indicators

The following three resources offer the most succinct information about technical overlays and indicators. You can find many more resources at some of the sites previously listed under the Beginner's section, under many of the Blogs & News resources, and at various brokerages.

  1. Forex-Business Technical Indicators — Where the other two sites offer great technical indicator explanations, this site offers 10 charts that illustrate some of those terms.
  2. IQ Chart — This company offers a list of technical overlays and indicators with short and easy-to-understand explanations. Take a look at their chart patterns while at this site, as this company is a provider of stock charting software to individual investors and technical analysts.
  3. Technical Indicators — Definitions provided by MetaQuotes Software.

X-Tras

  1. IFXTAG — The International Forex Traders Affinity Group provides individual investors access to products and services that are evaluated by top professionals and their members. IFXTAG is committed to harnessing the potential to make electronic trading work for their global community of subscribers. Membership is free, but the resources are not. Members, however, do receive free trials and discounts to various services.
  2. Secret Forex Society — A 'closed' forum and educational site where members ask you to join or you can ask to be placed on a waiting list. Go ahead and trust them. Get on the waiting list so you can access some interesting information.
  3. Traders Press, Inc. — An online bookstore specifically for traders.

Tuesday, December 9, 2008

Trading 2008-12-10

Open Long: 10,000 NZD/USD @ 0.54998
Stop level: 0.5422
Target level: 0.5588
Closed:

Open Short: 10,000 EUR/USD @ 1.29405
Stop level: 1.2855
Target level: 1.2994
Closed: 1.2933 (Loss USD 61.40)

Open Short: 10,000 USD/CHF @ 1.21179
Stop level: 1.2011
Target level: 1.2184
Closed: 1.2011 (Loss SF 106.90)

Open Short: 10,000 EUR/USD @ 1.28725
Stop level: 1.2972
Target level: 1.2743
Closed: 1.2972 (Loss USD 99.50)

Open Short: 10,000 EUR/JPY @ 119.20
Stop level: 121.00
Target level: 117.09
Closed: 121.0 (Loss JPY 17,990)

Existing positions remain the same.

Monday, December 8, 2008

Trading 2008-12-09

Open Short: 10,000 USD/CHF @ 1.21179
Stop level: 1.2011
Target level: 1.2184
Closed:

Open Short: 10,000 EUR/USD @ 1.28725
Stop level: 1.2972
Target level: 1.2743
Closed:

Open Short: 10,000 EUR/JPY @ 119.20
Stop level: 121.00
Target level: 117.09
Closed:

Open Long: 10,000 USD/JPY @ 93.456
Stop level: 92.50
Target level: 94.40
Closed: 92.50 (Loss 95.6 pips, ¥
9,560)

Open Short: 10,000 AUD/USD @ 0.6634
Stop level: 0.6730
Target level: 0.6545
Strong resistance at 0.6700
Closed: 0.6585 (Profit 49.10 pips, USD $49.10)


Existing positions remain the same.


Trading 2008-12-08

Open Long: 10,000 USD/JPY @ 93.456
Stop level: 92.50
Target level: 94.40

Open Short: 10,000 AUD/USD @ 0.6634
Stop level: 0.6730
Target level: 0.6545

Open Short: 10,000 USD/CHF @ 1.21402
Stop level: 1.2260
Target level: 1.2036
Closed: 1.21185 (Profit 21.7 pips, CHF 30.00)

Open Short: 10,000 USD/JPY @ 92.768
Stop level: 93.50
Target level: 91.73
Closed: 93.50 (Loss 73 pips, JPY 7,320, USD 79.80)

Existing position:

Open Long: 10,000 NZD/JPY @ 87.738
Stop Level:
Target Level:

Open Long: 10,000 NZD/JPY @ 87.917
Stop Level:
Target Level:

Open Long: 100 DBS Group @ $9.12
Stop Level: 8.62
Target Level:

Open Long: 100 DBS Group @ $9.10
Stop Level: 8.62
Target Level:

Sunday, December 7, 2008

Trading Strategy - Bollinger Bands with ADX

Bollinger Bands with ADX

Bollinger Bands are an indicator that allows users to compare volatility and relative price levels over a period time.
Using ADX with Bollinger Bands over 20 days period of time give strong signals:

bollingeradx

Signal to buy:
When the price below the lower band of Bollinger (20, 2) & DI+ over DI-, ADX line cross 20 level, ADX and DI+ rising and DI- falling.
Signal to buy:
When the price above the upper band of Bollinger (20, 2) & ADX line cross 20 levels and rising where DI+ falling and DI- rising.

Trading Strategy - RSI, ADX with Parabolic SAR

RSI, ADX with Parabolic SAR

The three where developed by J Welles Wilder, using RSI, ADX and Parabolic SAR for average 14 days will show great signals in entering the orders & closing them.

adxrsisar

Signal to buy:
1- When RSI cross 30 level and rising up
2- SAR dots below the price chart
3- DI+ over DI-, ADX line cross 20 level, ADX and DI+ rising and DI- falling.

Exit when SAR dots make a cross with the price chart & ADX moving below 30 from above while above +DI and –DI

Signal to sell:
1- When RSI cross 70 level & falling down
2- SAR dots over the price chart
3- ADX line cross 20 levels and rising where DI+ falling and DI- rising.
Exit when SAR dots make a cross with price chart & ADX moving below 30 from above
& above +DI and –DI

Trading Strategy - RSI with Momentum

RSI with Momentum

It measures the amount of change in commodity’s price during a period of time.
Using both RSI & Momentum for average 14 days will enable a solid strategy in determining signals.

rsimom

Signal to buy:
RSI rises above 50 but stays below 70, and momentum rises above zero.
Signal to sell:
RSI falls below 50 but stays above 30, and momentum falls below zero

Trading Strategy - MACD with Parabolic SAR

MACD with Parabolic SAR

Parabolic SAR is more popular for setting stops than for establishing direction or trend.
Parabolic SAR is base on the following rule: to shift the levels of closing prices only in direction of opened position.
If there is a long position opened before, it is possible to increase the level of closing prices, but not to decrease it.
If the short position is opened, it is possible to decrease the level of closing prices.
The indicator can be very effective if a filter of some sort is used like MACD.
If we were long the market, then only long signals would be taken and the short signals ignored as long as the filter has given a buy signal and remains in buy.
Now you can confirm the signal by using the both indicators.

Signal to buy:
When MACD bars is over 0 level and rising, signal line below bars end and rising and SAR dots below price chart.

Signal to Sell:
When MACD bars is below 0 level and falling, signal line over bars end and falling and SAR dots over price.
macdsar

Trading Strategy - MACD with RSI

MACD with RSI:

The MACD proves most effective in wide-swinging trading markets.
Crossovers: the basic MACD trading rule is to sell when the MACD falls below its signal line.
Average Convergence/Divergence rises above its signal line.
It is also popular to buy/sell when the MACD goes above/below zero.
Overbought/oversold conditions: The MACD is also useful as an overbought/oversold indicator.
When the shorter moving average pulls away dramatically from the longer moving average (i.e., the MACD rises), it is likely that the security price is overextending and will soon return to more realistic levels.
Divergence: An indication that an end to the current trend may be near occurs when the MACD diverges from the security. A bullish divergence occurs when the Moving Average Convergence/Divergence indicator is making new highs while prices fail to reach new highs.
A bearish divergence occurs when the MACD is making new lows while prices fail to reach new lows. Both of these divergences are most significant when they occur at relatively overbought/oversold levels.
Zero Line Crossovers: A crossing of the MACD line up through zero (the centerline) is interpreted as bullish, or down through zero as bearish.
Some analysts choose to buy or sell when the MACD goes above or below zero.
The RSI indicator ranges in value from 0 to 100, with numbers above 70 indicating overbought conditions and fewer than 30 indicating oversold

Signals to buy:
When the MACD rises above the Signal line & above Zero
When the RSI rises above 30

Signal to sell:
When the MACD falls below the Signal line & below zero
When the RSI below 70

macdrsi


Trading Strategy - ADX with Stochastic:

ADX with Stochastic:

ADX:
define trend force, whether the trend will develop further or will gradually weaken.

Three lines in ADX:
1) +DI (Yellow)
2) -DI (Red)
3) ADX line (Blue)

Stochastic: compares a stock's closing price to its price range over a given period of time.

Using the both will give traders great forecasting trend strength.

Two lines in Stochastic:
1) %K: This is the number of time periods used in the stochastic calculation.
2) %D: This is the number of time periods used when calculating the moving average of %K.

Signal to buy:
When either %K or %D falls below the line, and then again crosses the bottom level upwards or when the curve %K crosses the curve %D from below upward.
When +DI is higher than -DI

Signal to sell:
When oscillator grows above the line, and then crosses the top level downwards or when the curve %K crosses a curve %D from top to downward.
When +DI is lower than –DI

adxsoch

Currency Trading with ADX and Parabolic Sar

Currency Trading with ADX and Parabolic Sar
If there is one thing that a trader would want to know for certain, it would be to catch the bottom or top of a trend.

But simple as it sounds, it is easier said than done. Knowing that a certain price wave is completed, or is just a retracement in the larger trend, becomes more of an art than a science.

In such situations, using multiple sources of confirmation helps to avoid the potential false signals, and preserve our capital for only those situations that provide us with the most favorable risk to reward scenarios. Keeping that in mind, we will use two very different indicators – the ADX (Average Directional Movement Index) and the PSAR (Parabolic Stop & Reverse) - to form a system which should help us to trade as close to the top / bottom as possible.

First we shall look at both the indicators in detail, and find out their characteristics.

The ADX (Average Directional Movement Index)

The ADX is a trend-following system developed by Welles Wilder. Though it can be used as an independent indicator, it t is usually a part of the DMI indicator and determines the market trend.

Therefore, let us also briefly study the DMI indicator. This comprises of two lines – the Plus DI & the Minus DI lines.

The characteristics of the Directional Movement Indicator are: You establish a long position whenever the Plus DI crosses above the Minus DI. You establish a short position, when the Minus DI crosses above the Plus DI.

A simple DI+/DI- crossover is an entry and exit system. However, used that way it produces frequent whipsaws. Hence we combine this with the ADX to reduce these whipsaws.

The ADX thus forms an integral part of this system, as it gives a warning for a market about to change direction. It gives precise interpretations of the price action as follows –

The ADX tells you if there is a trend present or not. It also informs you if it is early or late in a trend.
It informs of a de-trending, of a reversal and renewal.
The ADX however does not indicate the direction of the trend, only the strength of the trend.
Now in our chart here, we have the red line as the minus DI, the blue line as the plus DI, and the green line is the ADX. I have drawn a line at the 20 level for the ADX, since the rise of the ADX above 20 signifies an emerging of a trend.

Overall if we observe only both the DMI lines (the blue and the red) it does give a correct picture of the trend, and keeps us in the correct side of the market.

Simply put, at the area marked with the red line, the –DMI line is above the +DMI line, signifying a downtrend.

And at the area marked with the blue line, the +DMI line is above the –DMI line, signifying an uptrend.

But what about the areas, where the DMI lines have frequent crossings. This is the kind of situation which will whipsaw out any position and this where the ADX is used in tandem.
The indication for an entry into a trend is when the ADX starts rising from the lows. And ideally the ADX should be pointed up at all times when entry is being considered

But we are concerned right now with the end of the trend.

The turning points in markets are often heralded by turns in the DI+/DI- at upper and lower extremes shortly followed by a down turn in the ADX. This setup is near coincident with major turning points.

Thus the conditions for exit are -

The DI+/DI- lines should show signs of declining momentum at their extreme levels, by turning down.
These lines should cross the rising ADX line down.
We look to exit the trade only when the ADX line starts to fall down.
The subsequent crossover of the DI+/DI- lines would give us an additional confirmation of the change in trend.

In case of an existing uptrend, the DI+ line would signs of flattening and then cross the ADX line (which could still be rising). The confirmation of the change of trend to the downside would come only when the ADX starts declining. This would be followed by the DI+ line crossing the DI- line down.

Similarly in case of an existing downtrend, the DI- line would signs of flattening and then cross the ADX line (which could still be rising). The confirmation of the change of trend to the upside would come only when the ADX starts declining. This would be followed by the DI- line crossing the DI+ line down.

This use of the ADX for the exits is called the "turning-point" concept. The relationship of the three lines with the ADX being the highest tells us that there has been an extended price move which is running out of momentum. If we apply our rules to our example here –


We will consider an entry only at this point marked ‘A’, when the ADX has started rising.
We consider exiting the trade, only when the plus DMI has reached an extreme level, and the ADX is turning down at this point.
Even though this is a high probability setup, we can use an additional confirmation factor, since there is some lag in decline of the ADX line, and the subsequent crossover of the DI+/DI- lines.

A lot of times, the crossover and the decline of the ADX occur much after the price has moved a considerable distance in the direction of the changed trend, and hence some profits in the new direction may have been missed.

With the intention of reducing this lag, and the idea that there would be room for further improvement, it was found that the PSAR provided much more timely entry triggers.

PSAR (Parabolic SAR)

The Parabolic SAR (Stop And Reverse) was developed by J. Welles Wilder Jr. and is primarily used in trending markets. Wilder recommended establishing the trend first, and then trading with Parabolic SAR in the direction of the trend.

The Parabolic SAR allows the trader to follow the dots in an upward or downward trend, until the trend reverses. Thus it is also called a reversal system, and is more popular for setting stops than for establishing direction or trend.

Interpretation -

If the trend is up, buy when the SAR moves below the price. This will be the stop level below the current price, which will move up every day until activated (when price falls to the stop level).
If the trend is down, sell when the SAR moves above the price. This will be the stop level above the current price, which will move down every day until activated (when price rises to the stop level).
The concept is that as the price rises, the dots will rise as well, first slowly and then picking up speed and accelerating with the trend. The SAR starts to move a little faster as the trend develops and the dots soon catch up to the price action. This is what we call as activating the stop level, and is taken as a signal to exit the long position.

Drawbacks –

Although it works extremely well in markets with a dominant trend, it fails miserably in horizontal or choppy markets.
If and when prices do not develop consistent trends, it creates a jerky SAR which makes it difficult to enter and exit.
Let us take the following example to get a better idea of the characteristics –


Let us examine the different situations of the SAR as described above.

We look at the initial long position, which we have marked on the chart. We can see that the SAR flips below the price, when the uptrend starts.

Similarly for the downtrend, we notice how it flips above the price, and can be taken as a stop level.

Combining the two indicators to form an effective technique.

In this case, we use the particular characteristics of the PSAR, that it works extremely well in markets with a dominant trend and that it accelerates steadily as the prices trend. The stronger the trend the closer the Parabolic gets to the prices, which is exactly what we are looking for.

So when the parabolic indicator is close to the prices and we have our ADX "turning-point" setup formed, we have all the ingredients for an excellent trade. Even a very small countertrend move will now quickly cross the Parabolic and signal an aggressive entry.

These entries will usually occur before the ADX starts declining. Hence this becomes a very reliable pattern that is designed to identify a major reversal in direction. Another advantage of using the PSAR is that we can use it to define our exits. We should exit our trade when the PSAR flips to the opposite side.

One can apply different money management principles for the exit of a trade, but the basic concept to remember is that a change is indicated when the PSAR flips to the other side of price.

http://forexsignalpips.blogspot.com/2008/11/forex-indicator-adx-parabolic-sar.html

Forex Trading Strategy #30 (T.N.T. Price explosion) more to come...

Forex Trading Strategy #30 (T.N.T. Price explosion) more to come...

Submitted by Arsalan, our valued contributor.

Hello everyone,

I want to share one amazing strategy which is actually based only on price and it does not requires any indicator. I call this strategy T.N.T.
I read this strategy on a blog and i thought that i should share it with everyone over here.

Here's the strategy:

1) On a daily bar chart spot a price explosion i.e a + 140 pip day.

2) Next the day the market should move 70 pips in the direction of explosion.

3) If the second condition is fulfilled enter long if price explosion is on upside and enter short if price explosion is on downside but entry should be made only if at the same time the market is 30 pips above or below the high/low of previous day respectively other wise you should wait until the 30 pips condition is fulfilled.One thing which is important is that sometime you will have to enter a trade at more than a 70 pips move because of the 30 pips condition i mentioned above but it should never be more than 100 pips move.

4) Stop loss - 50 pips.

5) Target - 100 pips or 11.30 of the next day, whichever is reached first.

Forex trading strategy #29 (Stochastic + EMAs' cross)

Forex trading strategy #29 (Stochastic + EMAs' cross)

Submitted by Arsalan

------------------------------------------------------------------------------

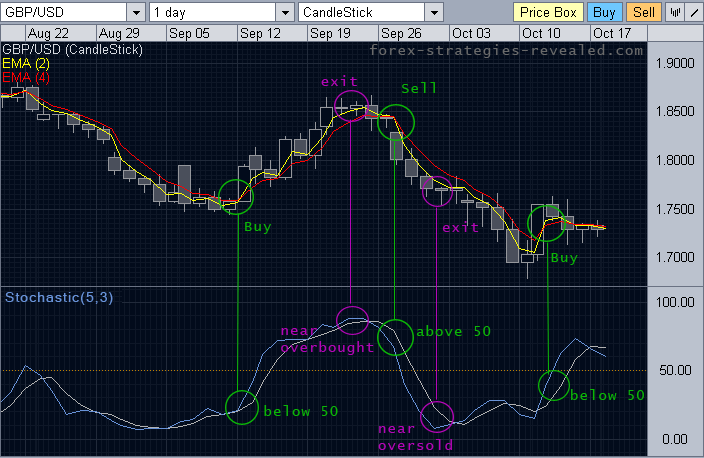
I have developed a new strategy and it is based on stochastic and exponential moving average. Although it is very simple but it is very effective for short term trading.
The strategy is as follows.

Time frame - Daily.

Indicators - Stochastic (5,3)
2 Days exponential moving average.
4 Days exponential moving average.

Buy Setup - Stochastic(5,3) should be BELOW 50.
Buy when 2 Days EMA crosses 4 Days EMA from
downside to upside.

Short Sell Setup - Stochastic(5,3) should be ABOVE 50.
Short Sell when 2 Days EMA crosses 4 Days EMA
from upside to downside.

Stochastic + EMA cross Forex daily system

Stop loss - Below low of the Entry day but it should not be more than 3 % from your entry price this is my way of using stop loss but you can use stop loss as per your risk appetite but try to maintain Risk:Reward ratio of at least 1:3.That is if your target is 15 your stop loss should not be more than 5.

Target - Exit when Stochastic(5,3) reaches near overbought zone i.e near 80 if you are long.

Exit when Stochastic (5,3)reaches near oversold zone i.e. near 20 if you are short.

2 Days and 4 Days emas crossover provides early entry into the trend and stochastic helps to filter out false signals.

I have tried my best to keep this as simple as i can and i hope everyone will like this strategy.


Forex trading strategy #28 (Trending pairs breakout grid system)

Forex trading strategy #28 (Trending pairs breakout grid system)

Trending pairs breakout grid system from Claus

-------------------------------------------------------------------------------

I choose the most violent pair, GBP/USD. I put stop loss orders above and
below the current price at an interval of 20 pips again. Current price is
about 1.7800 so here is the grid:

buy stop loss 1.7820 1.7840 1.7860 1.7880 1.7900 1.7920 1.7940
sell stop loss 1.7780 1.7760 1.7740 1.7720 1.7700 1.7680 1.7660

Eventually the market will go far from the current price, towards either
north or south. If I have more than 2.45 times buys than sells or more than
2.45 times sells than buys, the grid is is profit. Since the orders are
canceling their opposites, margin is a very small issue here. Lost capital
is also small. Obviously, if you set the grid just before London opening
you have a very small probability to have to wait for a few days until you
are in profit.


Forex trading strategy #27 (Arsalan's ADX + MACD)

Forex trading strategy #27 (Arsalan's ADX + MACD)

Submitted by Arsalan, our valued contributor.

----------------------------------------------------------------

Hi Edward,

I want to share one strategy which is based on macd and adx.
The strategy is as follows:

Time frame - Daily.

Indicators - Macd (3,10,18)
ADX(18) WITH + DI AND - DI LINES

BUY SETUP - MACD SHOULD GIVE BUY SIGNAL.
+DI SHOULD BE ABOVE -DI. IF +DI IS BELOW -DI AND MACD GIVES BUY SIGNAL THEN IGNORE IT AT THAT TIME AND WAIT FOR + DI TO GO ABOVE - DI TO MAKE A LONG ENTRY.

SELL SETUP - MACD SHOULD GIVE SELL SIGNAL.
-DI SHOULD BE ABOVE +DI .IF -DI IS BELOW +DI AND MACD GIVES SELL SIGNAL THEN IGNORE IT AT THAT TIME AND WAIT FOR -DI TO GO ABOVE +DI TO MAKE A SHORT ENTRY.

STOP LOSS - USE IT AS PER YOUR RISK APPETITE.

EXIT - USE TRAILING STOPS TO EXIT BECAUSE IT WILL ALLOW YOU TO CAPTURE MAXIMUM PROFIT.

One thing which is important while using this system is that you should trade with proper money management techniques.