A Journey to Master Forex Trading (FX Trader from Singapore)

Showing posts with label MACD. Show all posts

Monday, December 15, 2008

MACD (Moving Average Convergence/Divergence)

Quick Summary

Trading with MACD indicator includes the following signals:

MACD lines crossover — a trend is changing
MACD historam staying above zero line — market is bullish, below — bearish.
MACD histogram flipping over zero line — confirmation of a strength of a current trend.
MACD histogram diverges from price on the chart — signal of an upcoming reversal.

Details

MACD is the simplest and very reliable indicators used by many Forex traders.
MACD (Moving Average Convergence/Divergence) has in its base Moving Averages.

It calculates and displays the difference between the two moving averages at any time. As the market moves, moving averages move with it, widening (diverging) when the market is trending and moving closer (converging) when the market is slowing down and possibility of a trend change arise.

Basics behind MACD indicator

Standard indicator settings for MACD (12, 26, 9) are used in many trading systems, and these are the setting that MACD developer Gerald Appel has found to be the most suitable for both faster and slower moving markets. In order to get a more responsive and faster performance from MACD one can can experiment with lowering MACD settings to, for example, MACD (6, 12, 5), MACD (7, 10, 5), MACD (5, 13, 8) etc.
These custom MACD settings will make indicator signal faster, however, the rate of false signals is going to increase.

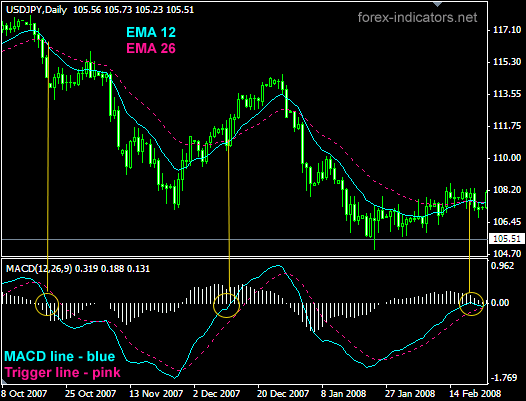
MACD indicator is based on Moving Averages in their simplest form. MACD measures the difference between faster and slower moving average: 12 EMA and 26 EMA (standard).

MACD line is created when longer Moving Average is subtracted from shorter Moving Average. As a result a momentum oscillator is created that oscillates above and below zero and has no lower or upper limits. MACD also has a Trigger line. Combined in a simple lines crossover strategy, MACD line and trigger line crossover outperforms EMAs crossover.

Besides being early on crossovers MACD also is able to display where the chart EMAs have crossed: when MACD (12, 26, 9) flips over its zero line, if indicates that 12 EMA and 26 EMA on the chart have crossed.

Forex MACD

How does MACD indicator work

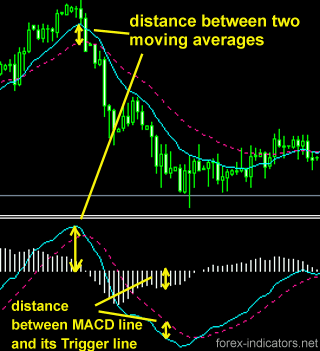
If to take 26 EMA and imagine that it is a flat line, then the distance between this line and 12 EMA would represent the distance from MACD line to indicator's zero line.
The further MACD line goes from zero line, the wider is the gap between 12EMA and 26 EMA on the chart. The closer MACD moves to zero line, the closer are 12 and 26 EMA.

MACD histogram measures the distance between MACD line and MACD trigger line.


Forex MACD trading

MACD indicator Formula

MACD = EMA(Close)period1 - EMA(Close)period2
Signal Line = EMA(MACD)period3

where
period1 = standard settings are 12 bars
period2 = standard 26 bars
perid3 = standard 9 bars

The following are the steps to calculate MACD

1. Calculate the 12-days EMA of closing price
2. Calculate the 26-days EMA of closing price
3. MACD = 12-days EMA - 26-days EMA
4. Signal Line = 9-days EMA of MACD

Formula for EMA

EMA = (SC X (CP - PE)) + PE

SC = Smoothing Constant (Number of days)
CP = Current Price
PE = Previous EMA

Trading MACD Divergence

MACD indicator is famous for its MACD Divergence trading method.

Divergence is found by comparing price shifts on the chart and MACD values.
MACD Divergence phenomenon occur as a result of shifting forces on the Forex market.
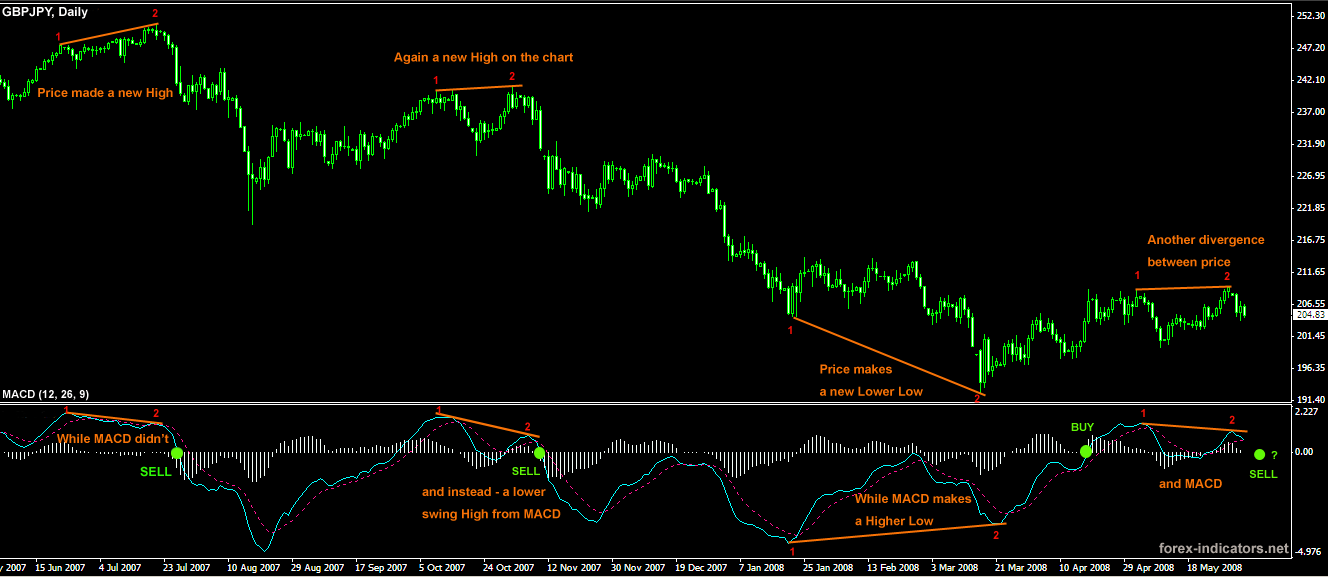
For example, while Sellers may seem to be dominating the market at the moment and price continues to trend down, there already might be signals for an overall weakening of Sellers power. This key warning moments can be observed with MACD indicator. What Forex traders would see is that despite price making new Lower Lows, MACD doesn't confirm that and instead registers a Higher Low, signaling that Sellers are running out of steam and a trend change is on its way.

Opposite will be true for Buyers.

How to trade MACD Divergence

When MACD line (on our screenshot it is a blue line) crosses Signal line (red dotted line) - we have a point (top or bottom) to evaluate. With two most recent MACD line tops or bottoms find corresponding tops/bottoms on the price chart. Connect MACD tops/bottoms and chart tops/bottoms.
Evaluate the lines received, as shown on the larger screenshot (click on the small picture to enlarge).

MACD divergence in Forex explained

With MACD divergence spotted Enter the market when MACD line crosses over its zero point.
Another entry strategy is to find 2 most recent swings high or low on the chart and draw a trend line trough them; and then set an Entry order on the breakout of that trend line.

MACD divergence trading method used not only to predict trend turning points, but also for trend confirmation. A current trend has high potentials to continue unchanged in case no divergence between MACD and price was established after most recent tops/bottoms evaluation.


Saturday, December 6, 2008

Trend Indicators: Moving Average Convergence Divergence (MACD) and OsMA

Reprinted from: http://www.alpari.co.uk/en/market-analysis-guide/technical-analysis/macd.html

Trend Indicators: Moving Average Convergence Divergence (MACD) and OsMA

Moving Average Convergence Divergence (MACD)

Some of the disadvantages of moving averages may be avoided by using the Moving Average Convergence Divergence (MACD). MACD is the difference between the fast 12-day exponential moving average (fast EMA) and the slow 26-day exponential moving average (slow EMA). Typically, this is plotted with the 9-day EMA of the indicator itself.

SIGNAL = EMA(9) [MACD],

where

  • MACD = EMA(12) [p] - EMA(26) [p];
  • p � price.

Bullish divergence appears when a new price top has not been confirmed by a new MACD top, i.e. price top is above the preceding top and MACD top is below the preceding top:

MACD Bullish Divergence

This signifies that the prevailing trend is weak. However, it is not recommended to open positions against the weakening trend as it is valid up to the moment of reversal. Bullish divergence only indicates that the trend is weak, not that it has ceased. So, before you open a position against the trend, find more significant confirmations that the trend is about to reverse (for example, the breakout of the trend line).

Bearish convergence appears when a new price bottom has not been confirmed by a new bottom of the indicator, i.e. the following price bottom is below the preceding one, and the following indicator bottom is above the preceding one:

MACD Bearish Convergence

This means that the bearish trend is weak but this is not a signal for reversal, so find other confirmations before opening a position.

When the price changes a bit and MACD moves around the zero line, this signals trend continuation.

In order to add Moving Average Convergence Divergence (MACD) to the chart use the "Insert -> Indicators -> Oscillators -> MACD" menu sequence.

In MetaTrader 4 MACD is represented as a histogram (MACD) and a signal line (SIGNAL).

MACD signals:

  • Levels which follow the signal line top or bottom are the alarms for a deal.
  • If MACD is below the zero line then trend is bearish, if it is above it then the trend is bullish.
  • SIGNAL line and price bullish divergence / bearish convergence � a strong sign that prevailing trend is weak.
  • If MACD is below zero and there is no bearish convergence, and MACD histogram crosses the slow line (SIGNAL) from below, then there are great chances for an upside price rebound.
  • If MACD is above zero and there is no bullish divergence and MACD histogram crosses the slow line (SIGNAL) from above, then there are great chances for a downside price rebound.

Moving Average of Oscillator (OsMA)

Moving Average of Oscillator (OsMA) is generally calculated as the difference between the oscillator and the moving average on the oscillator. In MetaTrader 4, MACD is used as an oscillator, and a SIGNAL (signal line) is used as a moving average:

OSMA = MACD-SIGNAL

Thursday, December 4, 2008

MACD

MACD

MACD is an acronym for Moving Average Convergence Divergence. This tool is used to identify moving averages that are indicating a new trend, whether it’s bullish or bearish. After all, our #1 priority in trading is being able to find a trend, because that is where the most money is made.

MACD

With an MACD chart, you will usually see three numbers that are used for its settings.

  • The first is the number of periods that is used to calculate the faster moving average.
  • The second is the number of periods that are used in the slower moving average.
  • And the third is the number of bars that is used to calculate the moving average of the difference between the faster and slower moving averages.

For example, if you were to see “12,26,9” as the MACD parameters (which is usually the default setting for most charting packages), this is how you would interpret it:

  • The 12 represents the previous 12 bars of the faster moving average.
  • The 26 represents the previous 26 bars of the slower moving average.
  • The 9 represents the previous 9 bars of the difference between the two moving averages. This is plotted by vertical lines called a histogram (The blue lines in the chart above).

There is a common misconception when it comes to the lines of the MACD. The two lines that are drawn are NOT moving averages of the price. Instead, they are the moving averages of the DIFFERENCE between two moving averages.

In our example above, the faster moving average is the moving average of the difference between the 12 and 26 period moving averages. The slower moving average plots the average of the previous MACD line. Once again, from our example above, this would be a 9 period moving average.

This means that we are taking the average of the last 9 periods of the faster MACD line, and plotting it as our “slower” moving average. What this does is it smoothes out the original line even more, which gives us a more accurate line.

The histogram simply plots the difference between the fast and slow moving average. If you look at our original chart, you can see that as the two moving averages separate, the histogram gets bigger. This is called divergence, because the faster moving average is “diverging” or moving away from the slower moving average.

As the moving averages get closer to each other, the histogram gets smaller. This is called convergence because the faster moving average is “converging” or getting closer to the slower moving average. And that, my friend, is how you get the name, Moving Average Convergence Divergence! Whew, we need to crack our knuckles after that one!

Ok, so now you know what MACD does. Now I’ll show you what MACD can do for YOU.

MACD Crossover

Because there are two moving averages with different “speeds”, the faster one will obviously be quicker to react to price movement than the slower one. When a new trend occurs, the fast line will react first and eventually cross the slower line. When this “crossover” occurs, and the fast line starts to “diverge” or move away from the slower line, it often indicates that a new trend has formed.

MACD Crossover

From the chart above, you can see that the fast line crossed under the slow line and correctly identified a new downtrend. Notice that when the lines crossed, the histogram temporarily disappears. This is because the difference between the lines at the time of the cross is 0. As the downtrend begins and the fast line diverges away from the slow line, the histogram gets bigger, which is good indication of a strong trend.

There is one drawback to MACD. Naturally, moving averages tend to lag behind price. After all, it's just an average of historical prices. Since the MACD represents moving averages of other moving averages and is smoothed out by another moving average, you can imagine that there is quite a bit of lag. However, it is still one of the most favored tools by many traders.